Training a model for DeepRacer involves getting a lot of data and then while you can ignore it, you can also analyze it and use for your own benefit.
You can spend an hour watching the stream as your car trains and observing its behaviour (and I've done it myself before), but you might not have the time to do this. Also, you might blink, you know? Finally, if your car is fast, like really fast, it could do all 5 evaluation laps in one minute. First you wait 4-7 minutes for the evaluation to start, then you see it take 4-7 minutes to stop. Video? Sorry, you've missed it.
Yeah, I'm stretching this a bit too far. Having data you can plot, compile, transform and replay over and over again will always be a handy solution. That's why I love what guys at Amazon have shared in the DeepRacer workshop repository (link takes you to GitHub).
Log analysis
While we're here, I hope you'll like this post. Once you're done reading, I'd like to recommend reading about what I have come up with based on this tool in "Analyzing the AWS DeepRacer logs my way" - it might help you and give a couple ideas for your own modifications.
The tools provided include a couple functions to help working with the data, track data, a Jupyter notebook that leads you through the analysis and some sample data.
It lets you assemble aggregated information about your car's performance, plot its behaviour on the track, plot reward values depending on the car's location during evaluation, plot the route during the evaluation (including the virtual race evaluation), analyse the behaviour depending on the visual input, detect which pieces of image matter to the car the most.
I may have lost my skills in statistics and might not be able to predict future trends based on the time series anymore (I still remember that the classic linear regression model is calculated with ((X'X)^(-1))X'y, I still have dreams of econometrics lectures with Professor Osiewalski), but I can appreciate good statistics when I see them. The guys at Amazon have provided an excellent tool that I have used before to present some images to you. I didn't however know what the ipynb file provided with the tools was. I mean, I managed to open it (GitHub comes with a viewer), but it wasn't until the AWS Summit that I actually installed Jupyter Notebook and understood what power it gives me. Nice!
Summit
Jupyter Notebook is a web application that provides an editor for files containing formatted text, code and its latest results. It can be either hosted or run locally. AWS provides a solution to view notebooks within the SageMaker, but if you tend to leave stuff lying around like me, I wouldn't recommend this solution. The pricing of it matches its usefulness and I tell you, this is a really, really useful tool. I'm exaggerating here, but it does add up if you leave the EC2 running.
The code can be in one of many languages, python included. I think more interesting stuff will come out of actually using the notebook.
Installation
To install it you need to be familiar with either Python or Anaconda. You will find the installation instructions on their website. I'll leave you with this, I am assuming that if you're here and still reading, you know how to install a Python interpreter and how to install modules.
Remeber you can also use Docker if you're familiar with it. This document (takes you to Jupyter documentation) describes how to do that. I think Tensorflow notebook docker image is the closest to what you need to run log analysis notebook without installing everything around.
Note: I am referring to instructions which in most cases contain details for Linux/Mac/Windows. I use Linux and so might miss the shortcomings of how other systems are described, but they do look well written. I am also assuming that you have some level of confidence working either with Python/pip or Anaconda/conda. In case of Python I use Python 3 and I recommend using it. It's time for Python 2.7 to go.
Project structure
In the log-analysis folder you will find a couple things:
intermediate_checkpoint- folder for data used in some of the analysislogs- folder for the logssimulation_episode- you'll be downloading images from the simulation to understand what actions the car is likely to taketracks- folder for the tracks pointsDeepRacer Log Analysis.ipynb- the notebook itselfcw_utils.py- utility methods for downloading of logslog_analysis.py- utility methods for the analysis
Dependencies to run log-analysis
Before we continue with running the notebook itself, let's have a look at the required dependencies that you can install using pip:
- boto3 - python library for interacting with AWS
- awscli - not really needed, but useful - I used it to run
aws configureand set up default access to AWS. Once I've done this, I didn't have to provide credentials in code. Click here for installation instructions, then click here for configuration instructions. Remember DeepRacer region isus-east-1. Click here for instructions to set up an IAM user. The roles listed in a page linked there do not provide permissions needed to get a list of streams in a log group, I've learned this one is part of role CloudWatchLogFullAccess or something like that. This is somewhat excessive so you might just want to apply permissionDescribeLogStreams - numpy, pandas, matplotlib, shapely, sklearn, glob - plotting, listing, showing nice numbers
- numpy, tensorflow, PIL, glob - analysis of actions probability (picture to action mapping)
- cv2, numpy, tensorflow, glob - analysis of an image heatmap (what the car cares about when processing the picture)
Some of those will already be available in your Python/Anaconda bundle or venv evironment. Others you should install yourself.
I may write a bit more about some of them at some point.
Running the notebook
We could have done that earlier, but I like being prepared.
To run the notebook, go to the log-analysis folder in a terminal and run:
jupyter notebook 'DeepRacer Log Analysis.ipynb'
A browser will open with a Jupyter notebook.
Running the code
The editor will look more or less like that:
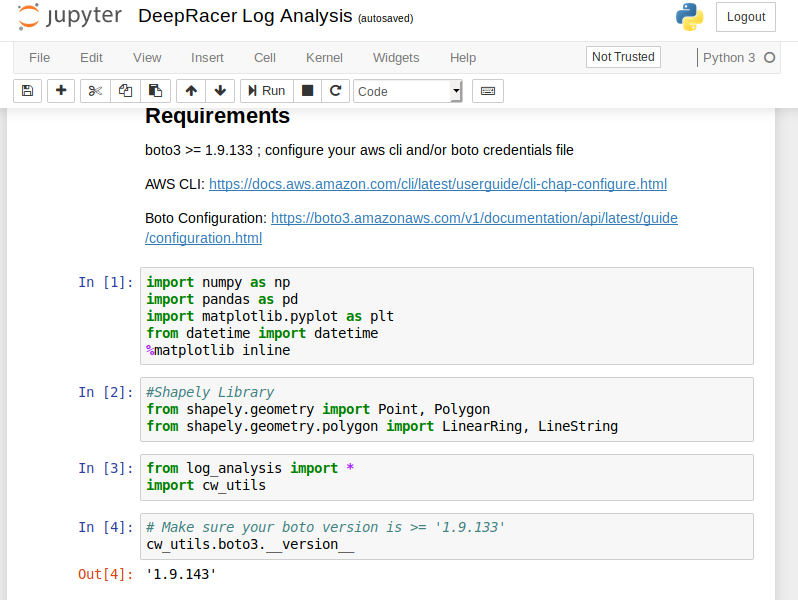
The usual stuff: some text, a toolbar, a menu, some code. When you get on the code section and press "Run" in the toolbar, the code executes, output (if available) gets printed out. That's pretty much how you go through the document: read, execute, analyse results of the code run.
You can find a couple more hints about working with Jupyter notebooks in a short document about using notebooks.
Analysis
When you start working with your notebook, be sure to execute the code blocks with imports at the top. They also include an instruction to display plotted images in the notebook.
The files currently available in the data folders are samples. You will be using your own and downloading them as you go through the notebook.
The notebook itself has quite a bit of helping code in it like the mentioned downloading of logs or loading the track info. I will not be covering it here.
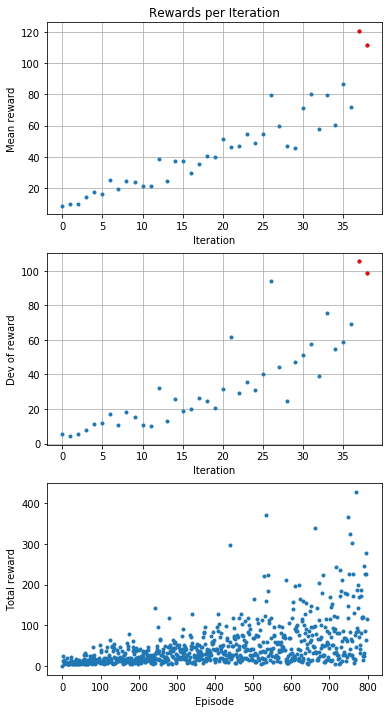
Plot rewards per Iteration
This analysis takes the rewards and calculates mean and standard deviation. It then displays those values per iteration. Also a reward per episode is presented.
Analyze the reward function
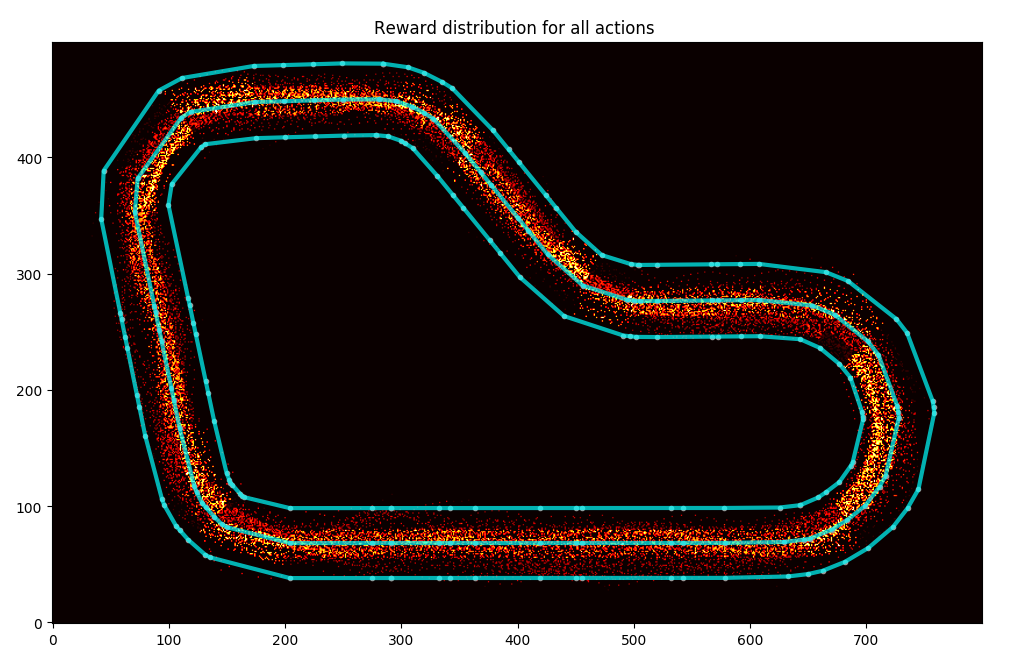
The next section uses the track data and training logs to display where the car goes and what reward it receives.
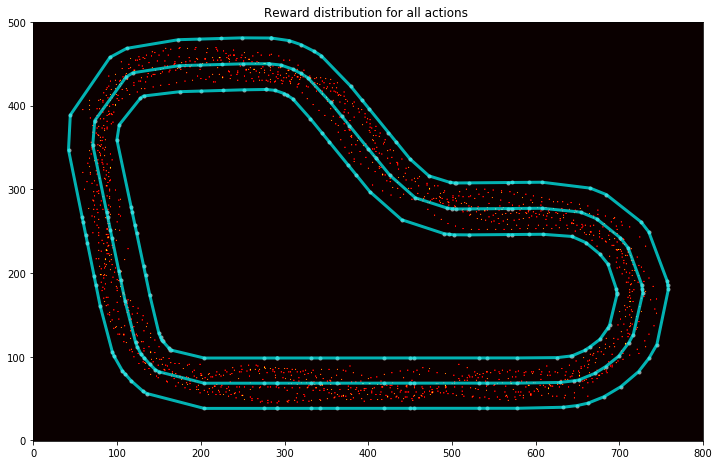
You can display all the points where the car had a reward function calculated:
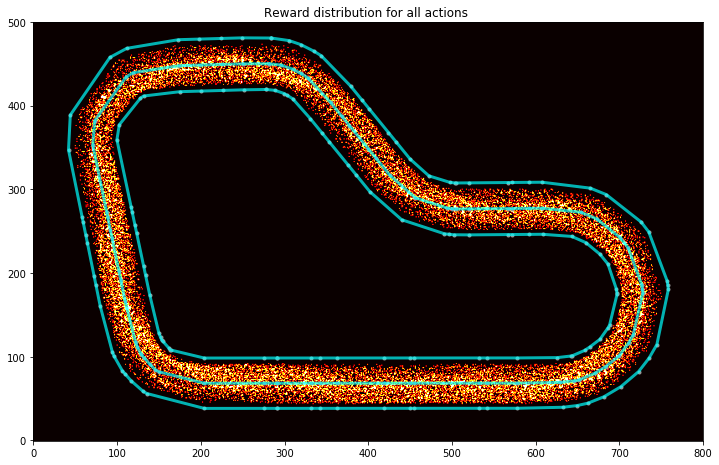
In this one above you can see how the car is all over the place. But then have a look at this one (this is a reward distribution for my AWS Summit London model):
As you can guess, I trained my model to cut corners and to go straight on the straight line.
You can display a specific iteration:
You can get top iterations and analyse the path taken:
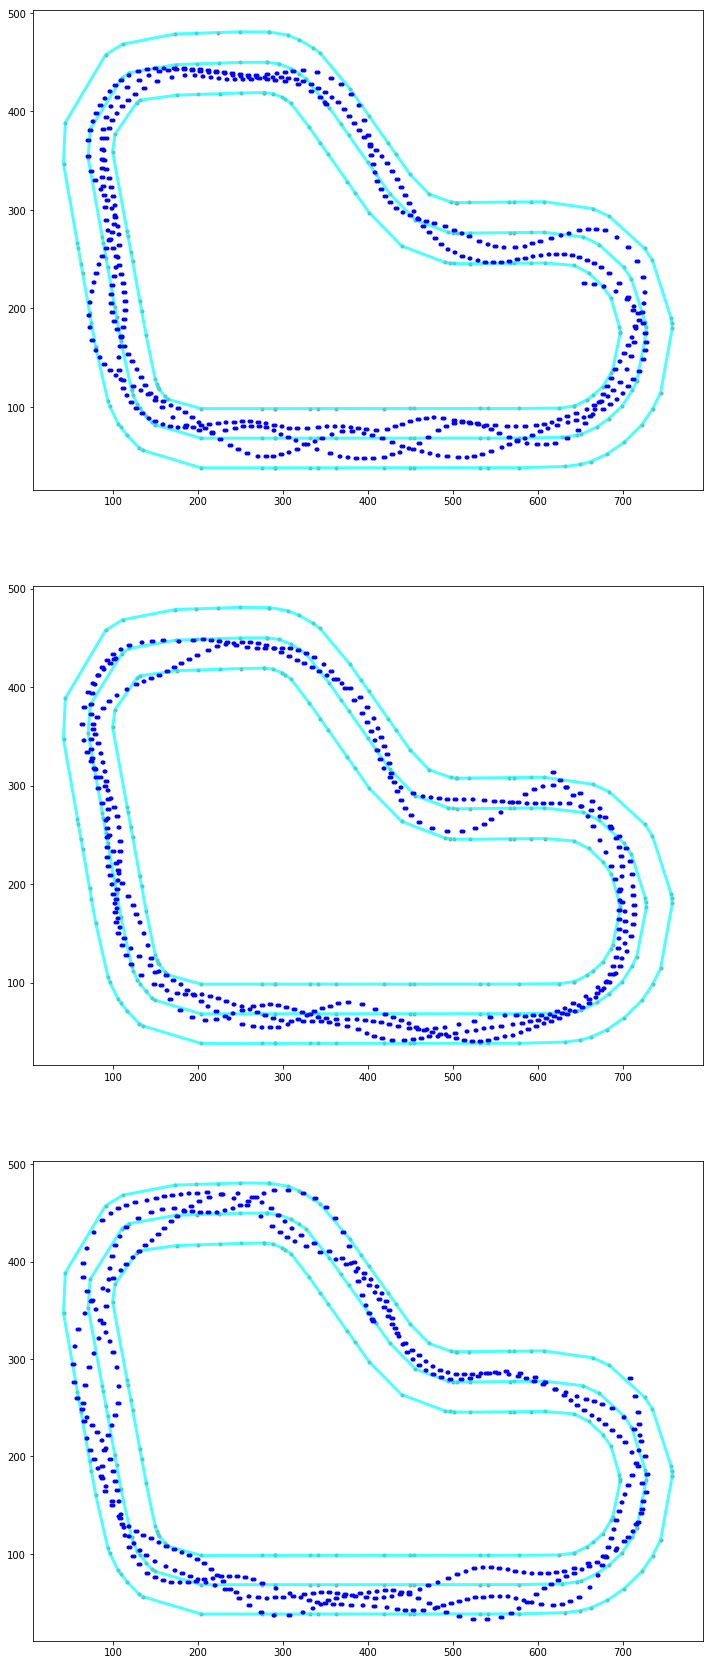
Or just a particular episode:
Or maybe a particular iteration:

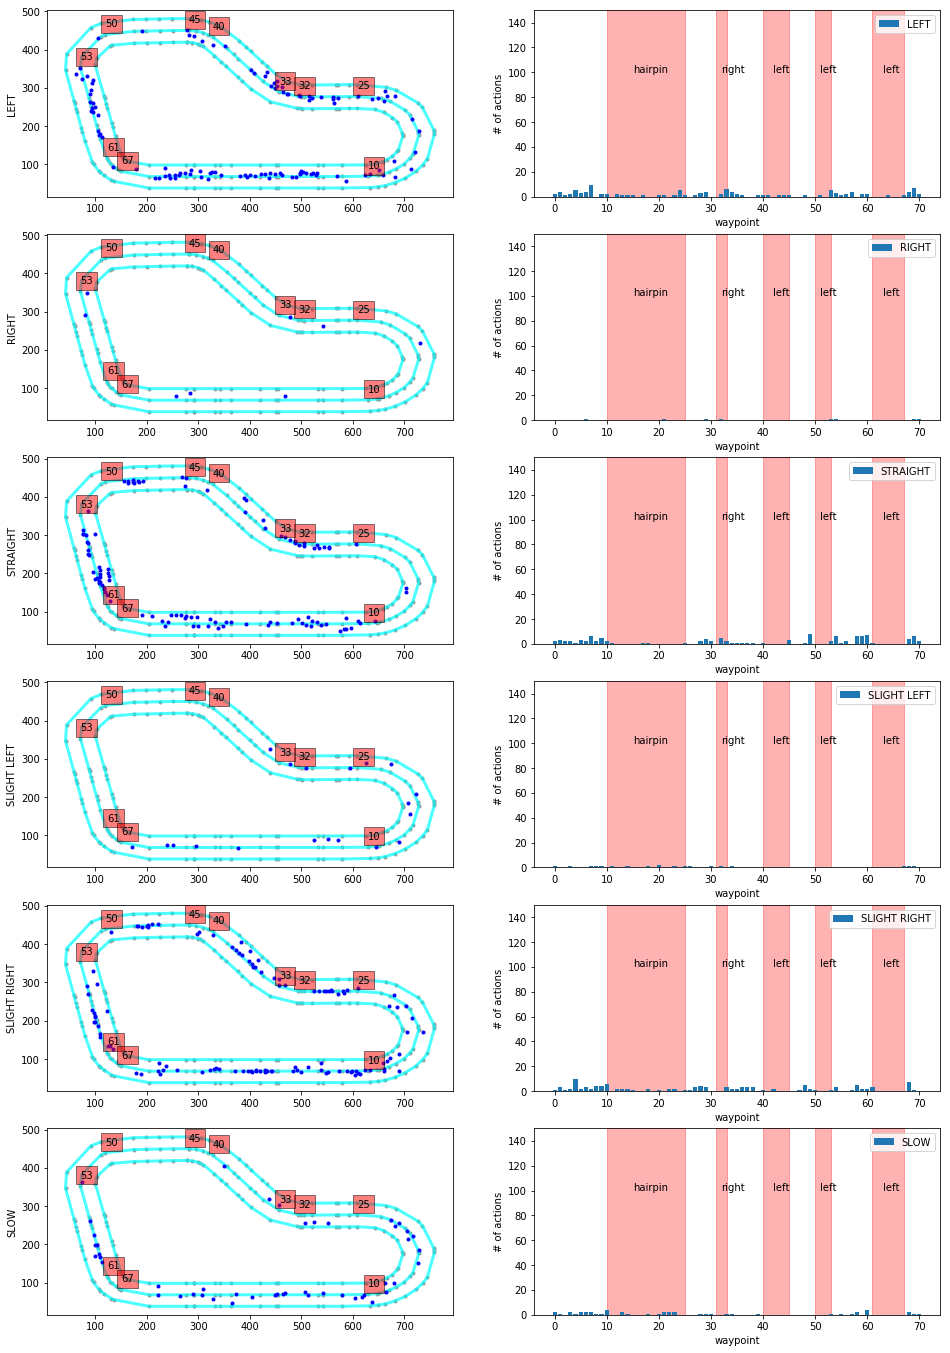
Actions breakdown
This function is pretty damn impressive, but applicable to the re:invent track only. I might spend some time and make something similar for the London Loop.
The output of this function is a graph of decisions taken in different parts of the track. The track is broken down into sections like turns and stuff, then the car's decision process is evaluated and displayed on a histogram. This may help you spot undesired decisions and discourage the car from taking them going forward. Just bear in mind that some wrong actions have a rather low impact and therefore it might be not worth training away from them as you might overtrain.
Simulation Image Analysis
In here you will be loading trained models, loading screens from simulation and observing probability of taking a particular action.
First you need to download the intermediate checkpoints, then load the session model from the file. The final graph displays separation of probability of taking particular actions. If I understand properly, this can be used to determine how confident the model is about taking a specific action. The bigger difference from the best to second-best action, the better.
I haven't used it before. I guess it will be handy when I understand more of it.
Model CSV Analysis
I don't really get this one, sorry. I thin it's just about downloading some metadata about the training and showing distribution of rewards and length of episode (the longer the episodes, the more stable the model.
I will have to learn to understand it better. The description says about downloading the model from DeepRacer Console, but the analysis is happening on some csv file only. Maybe it's part of the model archive?
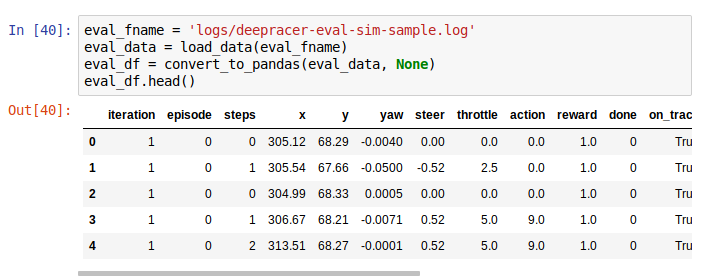
Evaluation Run Analysis
This is specifically useful since you can look at your evaluations both in the console and in the virtual race.
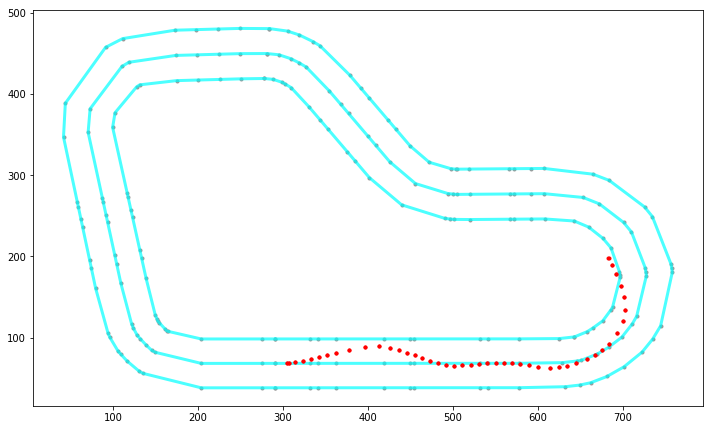
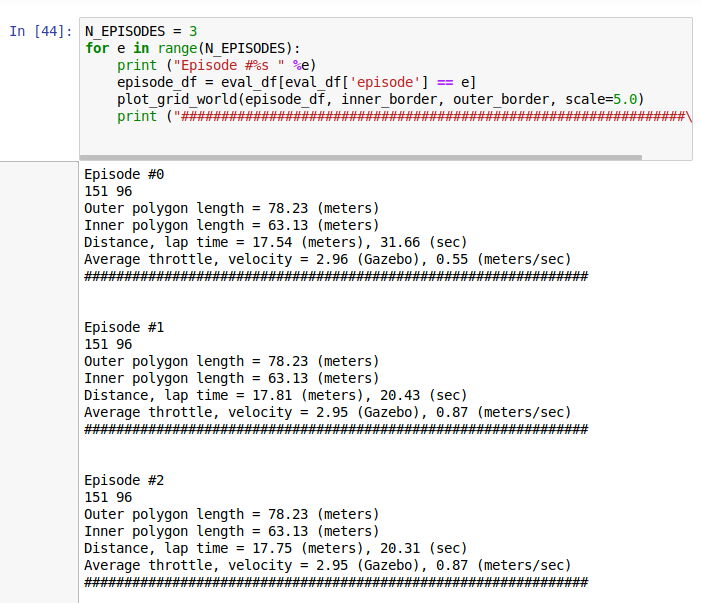
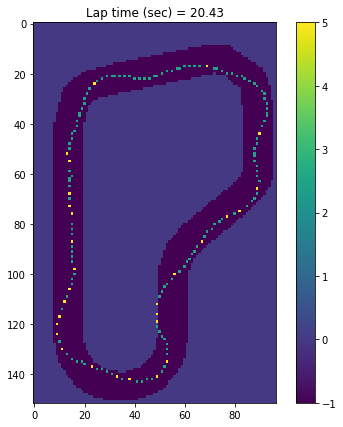
You can load logs from evaluation, then plot them on the track to see the path taken, distance covered, time, average throttle, velocity etc.
On the plotted images you can see what throttle decision the car has taken.
Just being able to compare faster and slower results from the evaluation can be very useful in terms of making decisions on future training sessions.
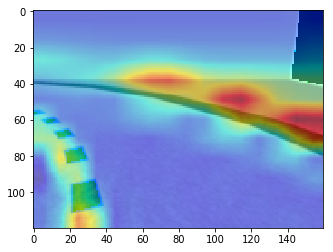
What is the model looking at
I haven't used this one yet and I treat it more like a helpful utility to understand what the model cares about. After loading a model and some images, it is possible to get a processed image with highlighted elements that are of value when making decisions. It looks like that:
Example
Let's say I want to analyse one of my virtual race evaluations. I want to see the race information from when I managed to do the 23 seconds. I located the log stream starting with sim-ynk2kzw3q7lf, located in /aws/deepracer/leaderboard/SimulationJobs.
Now I need to import stuff:
Then load the track data:
Then fetch the evaluation data and plot it (some small corrections to the code needed):
The result comes as a scrollable frame. It's quite annoying and can be expanded by a single click on the left margin:
Alternatively you can disable it in code as described on Stack Overflow.
From here you can clearly see I had a stable, but slow model. I made some advancements from that point, but I'll wait with sharing them till the London Loop virtual race is over.
Track data
The project contains some sample tracks. London Loop is not one of them, so because I'm taking part in virtual races, I prepared my own. You can get it from a GitHub pull request that I raised. Hopefully it will get merged soon, but at the moment you can got to my fork of the workshops repo and download the London_Loop_track.npy file from there.
Bulk logs download
The cw_utils.py is missing a method to download all of the logs in a given group. It would be handy, so I wrote my own: https://github.com/aws-samples/aws-deepracer-workshops/pull/20.
Parameters:
pathprefixis beginning of a relative file path,log_groupis the log group in CloudWatch that you want to download the logs from. The log groups you will be interested in are:/aws/robomaker/SimulationJobs- logs from training simulations and evaluations,/aws/deepracer/leaderboard/SimulationJobs- logs from evaluations submitted to a virtual race,
not_older_than- date string to provide the lower time limit for the log event streams; if there is at least one log event newer than that, the stream will be downloaded; For today logs (19th of May) I set it to2019-05-19; refer to dateutil documentation to learn about accepted formats,older_than- upper limit date, pretty similar as not_older_than but the other way round; If you set it to2019-05-19, the newest entries in accepted stream will be from 2019-05-18 23:59:59.999 at the latest.
Return value is a list of tuples containing:
- log file path
- simulation id
- first log event timestamp
- last log event timestamp
Entries are ordered by occurence of the last timestamp event.
If you are using a non-root account to access DeepRacer, you may be needed permissions to run method describe_log_streams.
If you call the method with pathprefix value ooh/eeh/ooh/ah/aah/ting/tang/walla/walla/bing/bang/deepracer-eval- and log_group is /aws/deepracer/leaderboard/SimulationJobs, and there is a log_stream for simulation sim-l337h45h, the file created will be ooh/eeh/ooh/ah/aah/ting/tang/walla/walla/bing/bang/deepracer-eval-sim-l337h45h.log
That's all folks
I'm not pretending I know much about the notebooks. Two weeks ago I didn't understand what they were or how to use them. This one has proven to be extremely useful when analysing my model's performance, and not only mine.
Well done, you've made it this far! Once again, let me mention my modification of the tool: "Analyzing the AWS DeepRacer logs my way" - I have raised a Pull Request to AWS with this change but you can already enjoy it now from my fork.
Great thanks to Lyndon Leggate for spotting that I misused the logs api initially. Lyndon is currently in top 10 in London Loop as well, he started the discussion group on Slack that I mentioned in my earlier posts. You are most welcome to join it: click here.
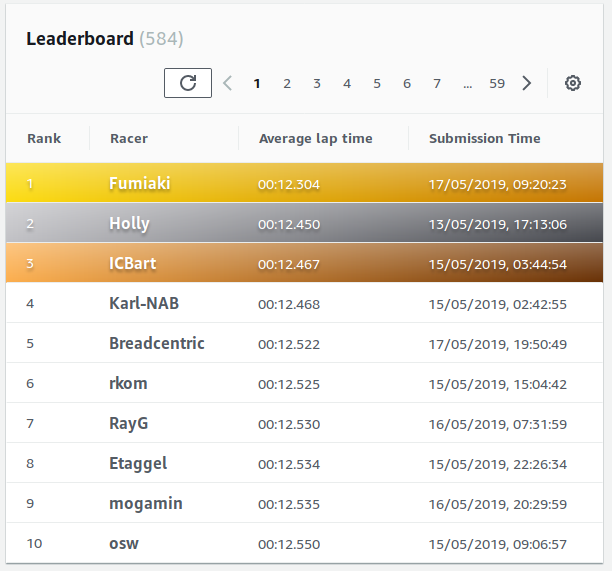
I will be soon writing about the First AWS DeepRacer League Virtual Race called London Loop which I'm taking part in. It's different from the London Loop and much bigger in scale - almost 600 participants so far (and more to come, I'm sure), still two weeks left to compete, top lap of 12.304 seconds and fifty best entries are within a second of that. And I'm fifth at the moment :)
Race on!